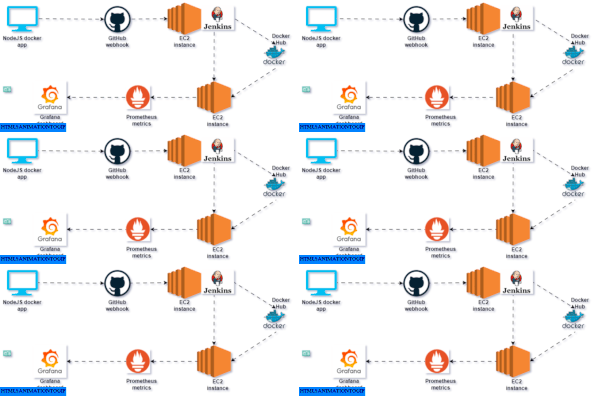
In this post we will deploy a simple containerized web application through Jenkins to an EC2 server, we deploy Prometheus and Grafana as containers to monitor the web application for security, operational state, and others. Note that the web app runs on two containers MySQL and Node application.
When you complete this project you should see that your EC2 instance is now running multiple containers (5 containers) which are for; Node application, MySQL, Grafana, Node Exporter, and Prometheus. All containers have been easily connected through the network we defined in our docker-compose file.
I want to state if you are building this as a project with the intention to learn from it then I suggest that you build the project first as I explained then when everything is working as required you can change something about the project or try out something in a different way than how I have done it.
I built the architecture myself for this project, I wasn’t following any particular tutorial, I built it incrementally i.e first building with a few containers and then adding other containers along the way, so I had lots of learning while building that’s why I suggest you modify a lot about the project so you can learn a lot too.
Prerequisite
You need familiarity with AWS as I won’t be going into the details when implementing on AWS. For any EC2 instance please select the free tier eligible T2micro type so you don’t get charged. Check out this post to learn more about Amazon EC2
We will use Jenkins as our CICD pipeline to automate the deployment of our containerized application to our EC2 instance.
Why Jenkins
Jenkins is an open-source automation server that helps automate software development processes such as building, testing, and deploying code changes to production. It is widely used in the DevOps industry to achieve continuous integration and continuous delivery (CI/CD) of software applications and one of the most important attributes is that it runs on our infrastructure.
Jenkins provides a user-friendly web-based interface, which allows developers to create automated jobs or tasks called pipelines. A pipeline in Jenkins is a set of instructions that define the stages of the software delivery process. It is a powerful tool that helps to streamline the software development process, improve productivity, and reduce errors.
A Jenkins pipeline is a combination of plugins that supports the integration and implementation of continuous delivery pipelines using Jenkins. It provides a way to define the entire software delivery process as code, which can be easily reviewed, versioned, and shared across the team.
A pipeline can be thought of as a sequence of stages that represent the steps in the software delivery process such as build, test, and deploy. The pipeline is written in a domain-specific language called Groovy, which makes it easy to define complex software delivery workflows. With the Jenkins pipeline, teams can automate the entire software delivery process, making it more efficient, reliable, and scalable.
The workflow in this case is simple, Jenkins gets triggered by GitHub webhook whenever there’s an accepted change in the codebase, Jenkins pulls the repository and builds it, it carries out any necessary tests and deploys the code to our EC2 instance through the public key-pair file we attached.
We would start with our GitHub repository
- Clone the repository to your local computer git clone https://github.com/willie191998/to-do-app-with-docker-jerkins-prometheus.git
- Initialize the repository git init
- Check the current branch git branch
- Make small changes and commit git commit -m <change details>
- Log in to your GitHub account and create a new repository. Copy the link to your new repository (it should end in .git)
- Connect your local repository to its remote GitHub repository, use the command git remote add origin <your new repo link>
- Push your files or changes to your GitHub repository, run the command git push origin master
Ensure you use the correct branch should be likely master to main. - You should now see the files in your GitHub repository.
Installation and Set Up of Jenkins

Create an EC2 instance, I used an Amazon Linux 2 OS but you can use Ubuntu or any other. Ensure you allow HTTP and SSH traffic for the EC2 instance also allow a custom port (port 8080) so we can access the Jenkins interface running on our server.
Please check out the previous post to learn how to set up an EC2 instance.
Install Java on our EC2 instance, connect your EC2 instance through SSH, see how to connect to your EC2 instance through SSH, and run the following command through SSH to install Java on your EC2 instance.
sudo dnf install -y java-11-amazon-corretto
sudo wget -O /etc/yum.repos.d/jenkins.repo  https://pkg.jenkins.io/redhat-stable/jenkins.repo
sudo rpm --import https://pkg.jenkins.io/redhat-stable/jenkins.io.key
The GPG key ensures that the packages you’re downloading are from the Jenkins repository and haven’t been tampered with.
sudo rpm --import https://pkg.jenkins.io/redhat-stable/jenkins.io.keyInstall Jenkins
Now that the GPG key is imported, you can proceed with the Jenkins installation.
sudo dnf install -y JenkinsStart and Enable Jenkins
Once Jenkins is installed, you can start the service and enable it to start on boot.
sudo systemctl start jenkins
sudo systemctl enable Jenkins
Check Jenkins Status
Verify that Jenkins is running correctly.
sudo systemctl status jenkins
Install docker and docker-compose
sudo yum update -y
sudo amazon-linux-extras install docker
sudo service docker start
sudo usermod -a -G docker ec2-user
sudo curl -L "https://github.com/docker/compose/releases/download/1.29.2/docker-compose-$(uname -s)-$(uname -m)" -o /usr/local/bin/docker-compose
sudo chmod +x /usr/local/bin/docker-compose
Configure Jenkins
Open Jenkins Web Interface
Visit http://your-ec2-public-ip:8080 in your web browser.

Retrieve the Initial Admin Password form SSH CLI
sudo cat /var/lib/jenkins/secrets/initialAdminPasswordComplete the Jenkins Setup Wizard;
Enter the admin password when prompted.
Install suggested plugins.
Create the first admin user and complete the setup.

Install Plugins
Jenkins plugins extend functionality, enabling seamless integration with tools, enhancing CI/CD pipelines, and automating tasks. Over 1,700 plugins support various stages of the development lifecycle.
These are the plugins you will need for this project; Git plugin, GitHub, Git Pipeline, Build Timeout, and Docker Pipeline.
Set up environmental variables for Jenkins
Go through this route in your Jenkins dashboard; Jenkins >> Manage Jenkins >> Manage Credentials >> Global >> New Credentials
Create new credentials, select username and password for the credentials type, and put in your GitHub username and password, this will be used for the GitHub access
Create another credential Select the public key, and put your AWS keypair file public key (You can get your public key from your ec2 instance key pair by printing the content of the keypair using the cat command).
You should copy the whole content as printed and paste it on the selected credentials public key field. Remember that you would use this same key pair when creating the other EC2 instance.
Create another credential, this time it is the username and password for your Docker Hub account, put in your correct Docker Hub details.
Also don’t forget to use a good ID for your credentials appropriately as it is what you will use to access it on your Jenkins pipeline.
You can also set environmental variables which can hold in details like your Docker Hub username but we won’t do that now.
Set up Jenkins Pipeline
Select – Manage Jenkins >> Select Create Pipeline >>
Under GitHub project select it and add the link of your GitHub repository without the .git

Under Definition select Pipeline script from SCM, under SCM select Git, put your GitHub repository link (the HTTPS form ending with .git) into the git repository field, and select the credentials you created earlier that have your GitHub username and password.

Select the Jenkins file to be executed on your pipeline as Jenkinsfile which is what we have on our repo.

Ensure you Select GitHub hook trigger for GITSCM polling.

Apply the details and Save the pipeline.
Connect GitHub to Jenkins
Log in to your GitHub and locate your repository, select settings from the list of options for that repository, and select Add Webhook.
Select Add payload and add the following URL http://<your-jenkins-IP>/github-webhook/
Set the Content type to application/json
Choose Just the push event
Click Add webhook
Remember to change the URL to use your Jenkins EC2 instance IP
Create your Hosting EC2 instance
Create a new EC2 instance as you have done before but with some minor changes but ensure you use the same keypair as before;

- Expose the following custom port for your instance SG group 1000 – 9090 TCP traffic
- Expose the SSH 443, and HTTP port 80 as before.
- Go to advance settings while creating the instance add the following script under user-data script to set a docker/docker-compose environment on your new EC2 instance
#!/bin/bash
# Update package information
sudo yum update -y
# Install Docker
sudo yum install -y docker
# Start Docker service
sudo systemctl start docker
sudo systemctl enable docker
# Add ec2-user to the docker group to run docker without Sudo
sudo usermod -a -G docker ec2-user
# Install Python 3 and pip
sudo yum install -y python3 python3-pip
# Install Docker Compose using pip
sudo pip3 install docker-compose
No worries if you can’t do this when you create your ec2 instance you can connect to it through SSH and run each of these commands individually and still get the same result.
You can connect to your instance through SSH and confirm your environment has been configured i.e. docker and docker-compose are installed.
docker --version
docker-compose --versio
Modify your Jenkinsfile
Open your Jenkinsfile from your local repository and modify the following content to your own details
- The credentials ID for Github, Docker Hub, and public key for EC2 instance.
- Modify the following parameters values; DOCKER_USERNAME, AWS_REGION, EC2_USER, EC2_IP, DOCKER_IMAGE_NAME, DOCKER_REPO.
Ensure you use the appropriate values for the following variables.
Make changes on your local repo and push the changes to GitHub following these commands
git add .git commit -m <changes details>git push origin masterYou should see your code build, it will run tests (if you defined any), it will push the image to your Docker Hub, and deploy the containers to your other EC2 instance, it automatically starts the process by stopping any running containers and deleting the current image before starting the new one so your instance runs your latest software.

You can SSH to your EC2 instance and confirm the container is running through the command docker ps you should see all the containers (5 in total) running on your EC2 instance. If any one container is not there then you can check the logs to know why the container is not running docker logs <container name>
Recall I mentioned that I built the containers incrementally, first with two containers; web app and MySQL then Prometheus and node exporter then Grafana but currently you have all the containers running on your instance, you can simply modify the docker-compose file if you want to start with any of those.
Access your containers running on your EC2 instance through the instance IP and the port the container is running on.
- Web App – <instance IP>:3000
- Prometheus – <Instance IP>:9090
- Grafana – <Instance IP>:4000
Note that Node Exporter and MySQL do not have a web interface so you can’t access them directly on your browser.

Connecting Prometheus as a Data Source to Grafana
Access your Prometheus interface on one window and your Grafana interface on another window


On Grafana, use the default username and password both are admin to log in then you will be asked to create a new password.

When you finally log in, you can explore the interface before connecting Prometheus as a data source.
Add Prometheus Data Source
- Click on the gear icon (Configuration) in the left sidebar. Select Data Sources from the dropdown menu
- Click on the Add data source button
Configure the Prometheus Data Source
- From the list of available data sources, select Prometheus.
- In the URL field, enter the address of your Prometheus server. If Prometheus is running on the same host as Grafana, http://prometheus:9090 as you are using docker containers else you can use <IP address>:9090 if running directly on the VM.
- Scroll down and click on the Save & Test button to ensure Grafana can connect to Prometheus
After clicking Save & Test you should see a message indicating that the data source was successfully added and is working.
Create and save a Dashboard in Grafana
- Click on the + icon in the left sidebar and select Dashboard, Click on Add new panel.
- In the Query section, select the Prometheus data source you just added. Enter a Prometheus query to fetch the metrics you want to visualize. For example, node_cpu_seconds_total to visualize CPU usage and node_memory_Active_bytes to visualize memory usage. Customize the panel settings, including visualization type (e.g. graph, gauge, table). Click on the Save button (disk icon) in the top right corner.
- Provide a name for your dashboard and save it.


Conclusion
While replicating this project, it is expected that you make some few mistakes especially if you have using this services for the first time so here are some useful command you can use for docker containers;
- docker pull: Downloads an image from a registry.
- docker build: Builds an image from a Dockerfile.
- docker run: Runs a container from an image.
- docker push: Uploads an image to a registry.
- docker ps: Lists running containers.
- docker stop: Stops a running container.
- docker rm: Removes a stopped container.
- docker rmi: Removes an image from the local repository.
- docker logs: Fetches logs of a container.
- docker exec: Runs a command in a running container.
- docker-compose up: Starts and runs containers defined in a docker-compose.yml file.
- docker-compose down: Stops and removes containers, networks, and volumes defined in a docker-compose.yml file.
- docker-compose build: Builds or rebuilds services defined in a docker-compose.yml file.
- docker-compose logs: Displays logs from services defined in a docker-compose.yml file.
I suppose you have some basic Linux skills to change directory, create directory, delete files, check and change file permission and ownership, etc. Because you will need those.
GitHub Repo
https://github.com/willie191998/to-do-app-with-docker-jerkins-prometheus.git
Other Relevant links
https://www.jenkins.io/doc/tutorials/tutorial-for-installing-jenkins-on-AWS/
https://www.cloudbees.com/blog/how-to-schedule-a-jenkins-job
https://dev.to/shersi32/how-deploy-a-containerized-app-on-aws-using-jenkins-3eje

